
How to Look Up Santa Clara County Jail Population Data
Population numbers for the county jail system come from the Sheriff's Custody Bureau page. The Custody Bureau page is the official source for headline figures such as average daily population, annual bookings, and average length of stay. It also lists the divisions that make up the system, from Classification and Custody Support Services to the Main Jail and Elmwood facilities.
For national and state context, the Bureau of Justice Statistics publishes the Annual Survey of Jails and the Jail Inmates series. Those datasets put the Santa Clara jail in line with other large county systems and give a per-100,000 rate that the Sheriff's page does not state on its own. The Sheriff page reads as a snapshot. The BJS data reads as a trend file. Both are used together for a full picture.
The Sheriff updates its Custody Bureau text from time to time, not in real time. BJS data lags by one to two years. Numbers on this page reflect the last figures the official pages have published.
Santa Clara County Jail Capacity Overview
The Custody Bureau runs three core facilities. The Main Jail Complex sits at 150 West Hedding Street in San Jose. Elmwood Men's and Elmwood Women's both sit on the Elmwood campus in Milpitas. The Main Jail's official page states the design capacity in plain numbers. Capacity for the two Elmwood facilities is not listed on the harvested official pages.
| Facility | Official Capacity | Notes |
|---|---|---|
| Main Jail Complex | 1,084 | Design capacity stated on the official Main Jail page. |
| Elmwood Men's Facility | Not located in official source | Visiting and rules pages give address and policies but no capacity figure. |
| Elmwood Women's Facility | Not located in official source | Same as Elmwood Men's; capacity not stated in the public pages. |
| System total | Not fully located; ADP 2,900 | Total rated capacity needs BSCC jail profile or Sheriff annual reports. |
Note: With an ADP near 2,900 and a stated Main Jail design capacity of 1,084, most of the held population sits outside Main Jail, mainly at Elmwood. Overcrowding math is not run here until the rated Elmwood capacity is confirmed from a Board of State and Community Corrections jail profile or a Sheriff annual report.
Average Daily Population
The Sheriff's Custody Bureau page states an average daily population of about 2,900. ADP is a count, not a flow. It is the mean number of people held in custody on any given day across the system, averaged over a year. ADP is the cleanest single number for sizing a jail because it smooths out the bumps from booking spikes and weekend releases.
ADP is not the same as total people booked in a year. A jail can book tens of thousands of people in a year yet still hold only a few thousand at any moment, because most bookings cycle out fast on cite-and-release, bail, or short stays. ADP captures the resident population. Bookings capture the door traffic.
Note: ADP shifts a little year to year, but the Sheriff page has stated 2,900 as the working figure for the current period.
Annual Bookings and Length of Stay
The Custody Bureau page states that about 30,000 arrestees are booked into county jail facilities each year. That figure counts intake events, not unique people. A person booked twice in one year is counted twice. The 30,000 number sits next to the 2,900 ADP and the stated average length of stay of about 292 days. Used together, the three numbers paint a system where most of the door traffic moves through fast, while a smaller core stays long enough to push the average up.
Some terms get mixed up in news coverage, so quick definitions help:
- Average Daily Population (ADP)
- The mean count of people held in custody on a given day, averaged over a year. The Custody Bureau cites 2,900.
- Annual Bookings
- The count of intake events at the jail in a year. The Custody Bureau cites about 30,000. One person booked twice counts as two.
- Average Length of Stay
- The mean number of days a held person stays in custody for a single booking. The Custody Bureau cites about 292 days.
Length of stay of about 292 days is high for a county jail. That number tends to reflect a mix of long pretrial holds for serious felonies and sentenced felons held locally under California realignment. The Sheriff page does not break the figure down by status.
Main Jail Budget and Staffing
The Sheriff's Main Jail page states an annual budget of about $76 million for the Main Jail and a staff of 470 badge and civilian personnel. That figure is facility-specific. It is not the systemwide custody budget, and it should not be divided by 2,900 ADP to claim a per-inmate cost for the whole system. Elmwood has its own budget and its own staffing line that the harvested pages do not state.
The Main Jail books about 30,000 of those 30,000 county arrestees each year, since intake for the county runs through Main Jail before classification routes people to Elmwood or back out. So the Main Jail budget pays for the intake function for the whole county plus the daily run of about 1,084 design beds at the Hedding Street complex.
National and State Context
The Sheriff's Custody Bureau page sets the system in three rankings: fifth largest jail system in California, among the 20 largest jail systems in the United States, and among about 100 systems nationwide with an inmate population over 1,000. Those rankings put Santa Clara well above the median county jail, which holds far fewer than 1,000 people. National jail statistics come from the Bureau of Justice Statistics.
| Frame | Where Santa Clara County Sits |
|---|---|
| California ranking | Fifth largest jail system in the state. |
| National ranking | Among the 20 largest jail systems in the United States. |
| 1,000-plus systems group | Among the roughly 100 nationwide systems with a population above 1,000. |
| National data source | Bureau of Justice Statistics, Annual Survey of Jails. |
Federal custody data sits in a different file. The federal Bureau of Prisons inmate locator and federal case data via PACER cover people held under federal charges. The county jail does not house federal sentenced inmates by default. Federal context here is for completeness, not for a per-100,000 jail rate.
Direct Supervision at Main Jail
The Main Jail uses direct supervision as its core inmate management model. One officer oversees a locked module or dormitory of up to 96 inmates. The officer is in the housing area, not behind glass. That model is meant to manage behavior through close, constant contact rather than reactive intervention.
Each cell has a toilet, a sink, a mirror, and a bed. Inmates eat and join programs in a common day room with tables, chairs, and telephones. That layout shapes population planning. A direct-supervision module is designed for up to 96 inmates, so capacity math at Main Jail is set in 96-bed units, not in single cells.
The Main Jail also uses indirect supervision in some areas. The mix shifts a little by classification level and by housing assignment.
Pretrial vs. Sentenced Population
County jails hold two main groups. The pretrial group is people booked and not yet convicted, held on bail, no-bail, or remand. The sentenced group is people serving a county jail sentence, often under California's 2011 realignment that moved certain felony sentences from state prison to county jail. The split between the two matters because it shapes length of stay, classification, and program needs.
Santa Clara's exact local pretrial-versus-sentenced share is a research gap. The harvested Sheriff pages do not publish a current percentage breakdown for the county system. For the official numbers on that split, the best sources are the Board of State and Community Corrections jail profile for Santa Clara County and the County's annual budget documents that fund the Sheriff. Those sources are listed in the Where the Data Comes From section near the end of this page.
Note: Length of stay of 292 days suggests a large share of long-hold cases, which often skew toward pretrial felony holds and post-realignment sentenced felons.
Demographic Breakdown
The Sheriff's Custody Bureau page does not publish a demographic breakdown of the held population by sex, race, age, or charge type. That is a research gap. The information exists in other official sources, but it is not on the harvested public Sheriff pages.
The county's Sheriff newsroom sometimes posts demographic context inside use-of-force or program reports, but the figures are not consolidated. The newsroom is a good place to check for ad-hoc data drops.
One image of the newsroom landing page is below. The newsroom links to Sheriff press releases where new population, use-of-force, and program data tend to land first.
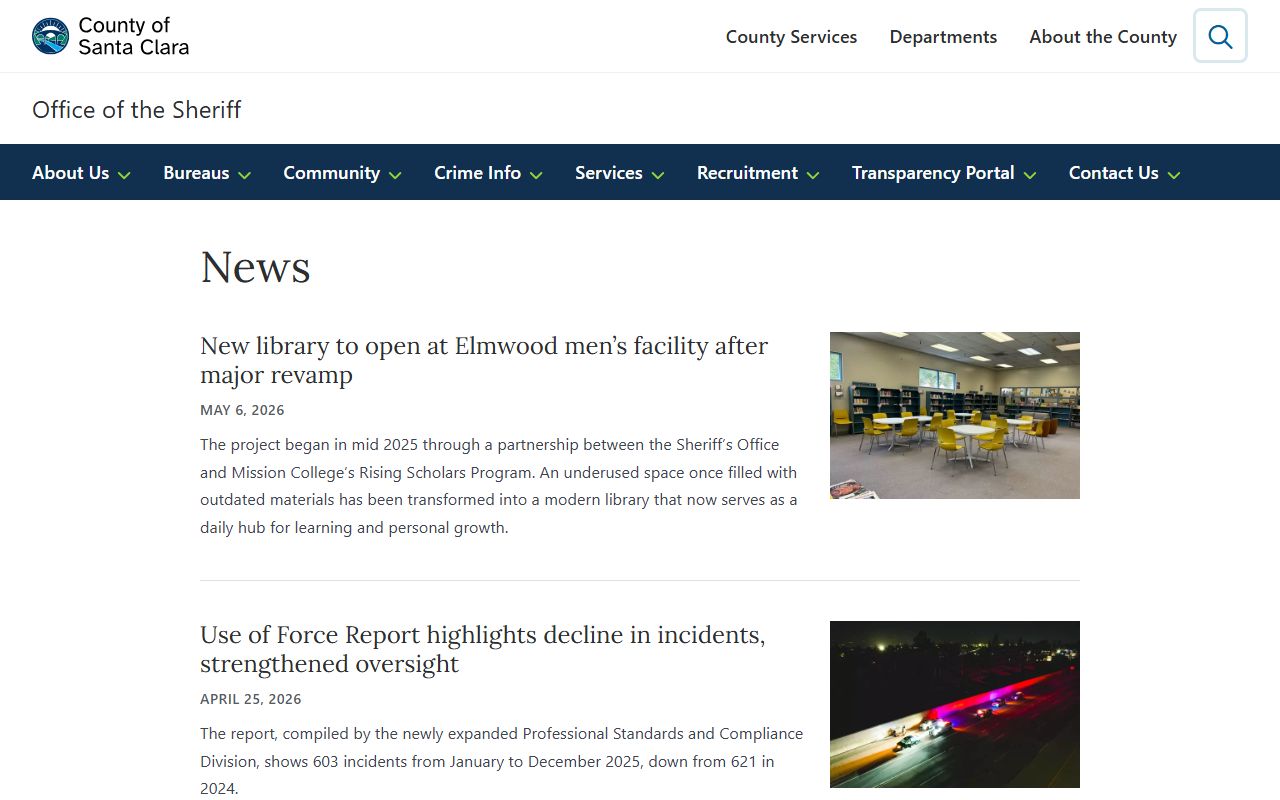
The newsroom is the best near-term feed for any new jail population data the Sheriff chooses to publish, including reports tied to use-of-force, classification, or facility realignment.
Searching Individual Santa Clara County Inmate Records
The figures on this page are aggregate jail population data, not name lookups. For a name-based search of the live county jail roster, including booking number, custody status, and next court date, use the Santa Clara County inmate records page. Recently released custody status is covered on the released inmates page. Outstanding warrants are on the warrant records page.
Recent Custody Trends and Reforms
The Sheriff's newsroom is where the latest custody operations and reform updates land. These figures and initiatives are tied to operations, not to total population, but they shape how the held population is managed day to day.
An April 2026 Sheriff release pointed to the Use of Force Report for calendar year 2025. The Professional Standards and Compliance Division reported 603 incidents in 2025, down from 621 in 2024.
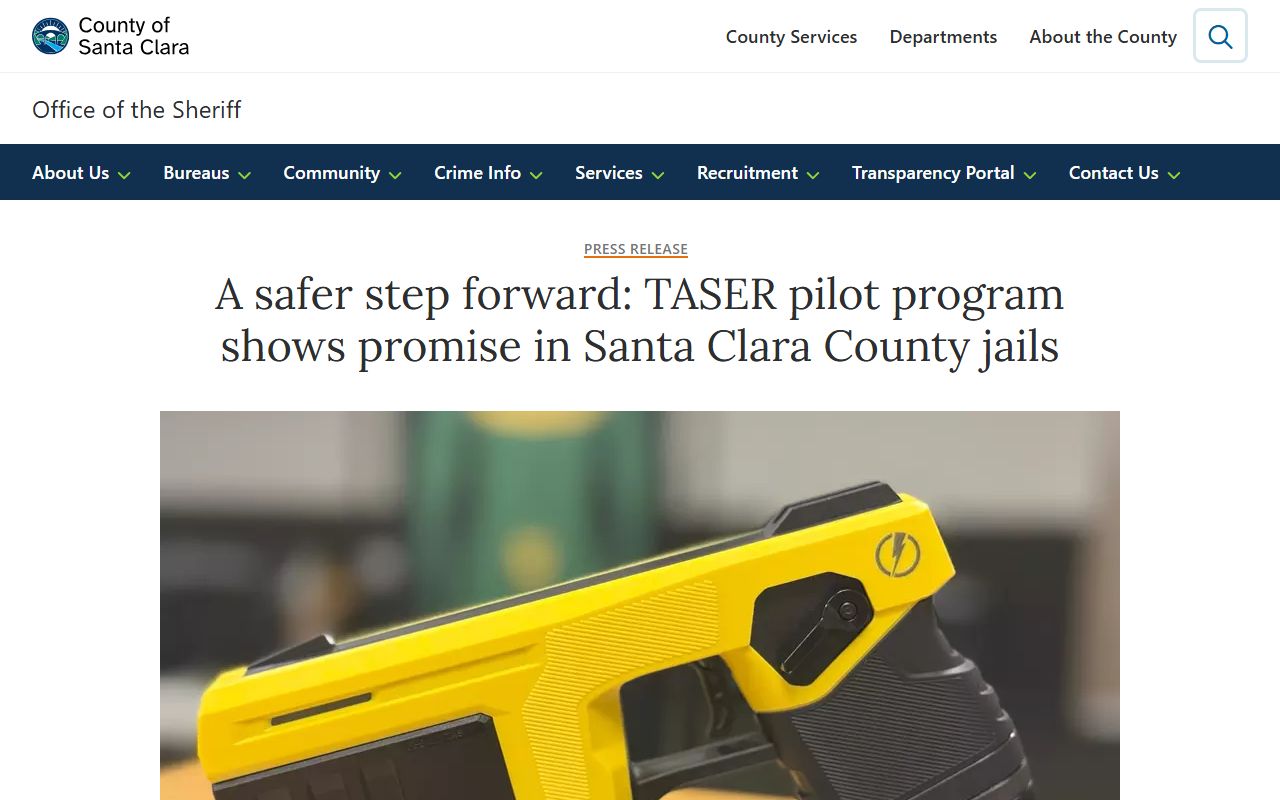
An August 2025 update from the Sheriff said the TASER 10 pilot program in custody facilities was showing promise five months in, with reduced need for physical force. A formal report on the pilot was planned for the following months.
An April 2025 release covered the first phase of the Elmwood camp realignment. The Sheriff said the realignment was meant to improve safety, operations, and rehabilitation opportunities. Legal visits stayed open, and a new visitation schedule rolled out alongside the move.
A January 2026 release covered drug-smuggling intercepts at jail facilities. Deputies and a K9 seized nearly 400 grams of suspected methamphetamine along with tobacco and a vape pen.
That release sits with the broader contraband-control trend at Elmwood and Main Jail. The intercept counts are a window into custody operations rather than a direct population metric, but they affect classification and housing.
Federal appellate context for the region runs through the Ninth Circuit Court of Appeals, which hears appeals from federal district courts covering Santa Clara County and shapes federal-court rulings that touch jail conditions.

Ninth Circuit case law on conditions of confinement, use-of-force, and pretrial detention applies to the Santa Clara jail system. Sheriff policy changes on TASER use and direct supervision sit inside that federal legal frame.
Where the Data Comes From
Numbers on this page are pulled from a small set of official sources. Each one has a different lag and a different scope. For deeper figures, including the demographic and pretrial-versus-sentenced gaps noted earlier, the sources below are the ones to consult.
- Santa Clara County Sheriff Custody Bureau — ADP, annual bookings, length of stay, system rankings.
- Main Jail Complex page — Main Jail design capacity, budget, staffing, direct supervision detail.
- Sheriff newsroom and press releases — use-of-force counts, TASER pilot, Elmwood realignment, smuggling intercepts.
- Bureau of Justice Statistics — national and state jail statistics, Annual Survey of Jails.
- BSCC jail profile for Santa Clara County and the County's annual budget for the Sheriff — consult for demographics, capacity, and pretrial-versus-sentenced splits not on the public Sheriff pages.
For court-side context that ties to held population, see the Santa Clara County Superior Court page and the criminal records page. General questions on jail data, custody, and records pull-through are on the FAQ page.